
“Arria provides us with technology to dramatically improve the speed and efficiency of our reporting”
An App for Every Use Case — Plus, Arria Answers
Arria for Power BI includes 10 language analytics apps out-of-the-box, allowing users to accurately narrate a wide range of dossier visuals.

Descriptive Statistics
Generate a summary of quantitative insights

Target-Based Variance
Analyze the variance between actual value and the target value

Time-Based Variance
Analyze the variance in performance for two time periods

Pie Chart Visual
Describe a pie chart and highlight statistically relevant insights

Bar Chart Visual
Describe a bar chart and highlight statistically relevant insights

Line Graph Visual
Describe a line graph and highlight relevant insights

Ranking Analysis
Analyze the top and bottom ranked dimensions

Trend Analysis
Analyze change over time while highlighting significant trends

Correlation Analysis
Detect correlation between multiple series of data points

Anomalies Analysis
Describe a line chart and highlight statistically relevant insights
Trusted by Industry-Leading Organizations
Stop Screenshotting your Dashboards
If you would like to reduce the time and frustration of understanding your Power BI dashboards, or, having to explain them to colleagues and leadership by creating additional presentations, Arria for Power BI is your answer.
Education for Everyone
Download one of the resources below to discover the true power of Arria for Power BI — and share it with your team.
Fact Sheets
Arria for BI
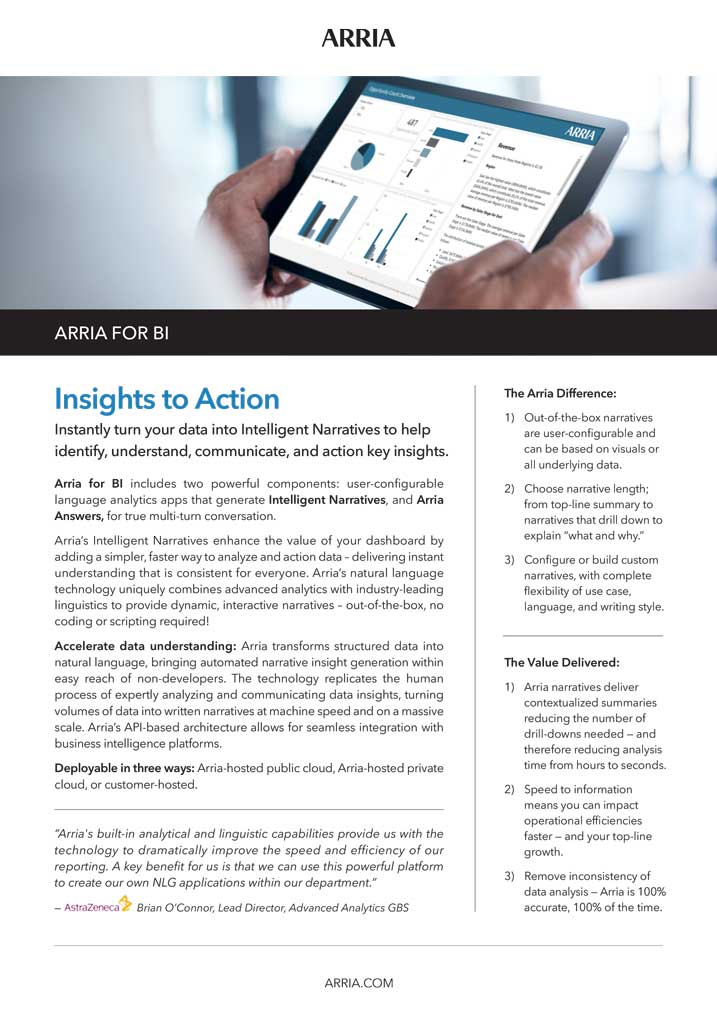
Instantly turn your data into actionable Intelligent Narratives.

Brochures
The Arria Difference
View the key differentiators that put Arria ahead of the competition
Brochures
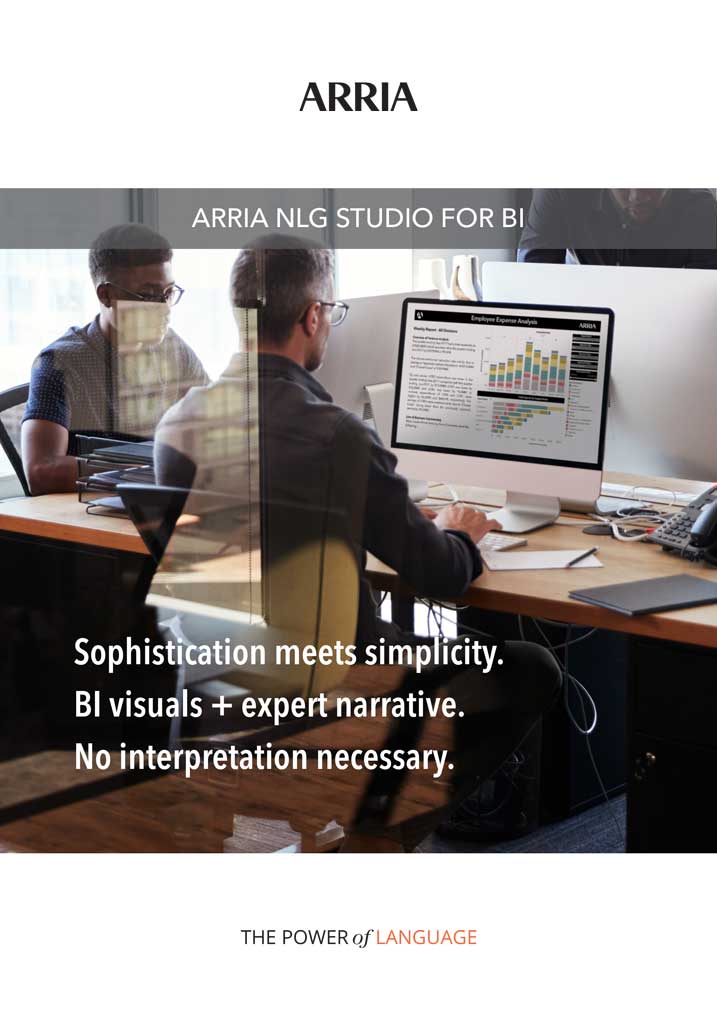
Arria Studio for BI
Create BI dashboards that are simpler and faster to interpret