Arria for Tableau
We make it simple for you to quickly identify, communicate, and action key insights with out-of-the-box narratives that are configurable, customizable, and easily authored by you!
See how you can seamlessly integrate advanced natural language to visuals, or leverage all underlying data for a more robust experience. Choose Arria Hosted or Customer Hosted (On-Prem).
“We’re working with Arria to help clients significantly reduce the amount of time they spend writing reports”
There’s an Arria App for that
Discover Arria’s growing list of out-of-the-box Apps and how they generate insightful narratives and executive summaries for your most popular Tableau visuals and their underlying data.

Descriptive Statistics
Generate a summary of quantitative insights

Target-Based Variance
Analyze the variance between actual value and the target value

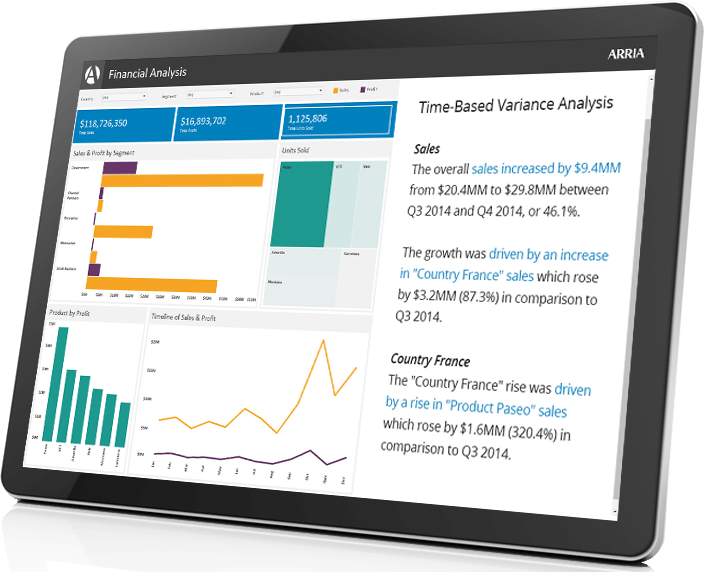
Time-Based Variance
Analyze the variance in performance for two time periods

Pie Chart Visual
Describe a pie chart and highlight statistically relevant insights

Bar Chart Visual
Describe a bar chart and highlight statistically relevant insights

Line Graph Visual
Describe a line graph and highlight relevant insights

Ranking Analysis
Analyze the top and bottom ranked dimensions

Trend Analysis
Analyze change over time while highlighting significant trends

Correlation Analysis
Detect correlation between multiple series of data points

Anomalies Analysis
Describe a line chart and highlight statistically relevant insights
Tableau Partners for Success
Arria partners share our mission of “NLG everywhere”, and play a critical role in the expansion and adoption of Natural Language technologies. If you are a dashboard provider interested in embedding NLG into your product, the Arria partner program can help.
Stop Screenshotting your Dashboards
If you would like to reduce the time and frustration of understanding your Tableau dashboards, or, having to explain them to colleagues and leadership by creating additional presentations, Arria for Tableau is your answer.